Maha Board (MSBHSE) Class 8 Math (गणित) Statistics Practice Set 11.3 Solution (Page No. 71) in our website. Here candidates of Marathi Medium & English Medium of Maharashtra State can follow this to get Most Easy Solution of Maharashtra Board Class 8 Chapter 11: Statistics (Practice Set 11.3).
Maharashtra Board Class 8 Math Practice Set 11.3 Solution | BalBharati Class 8 Mathematics Chapter 11 Solution:
| Subject | Mathematics (गणित) |
| Class | 8 (८) |
| Chapter | 11 (११) |
| Practice Set | 11.3 |
Practice Set 11.3 Solution (Page No. 73)
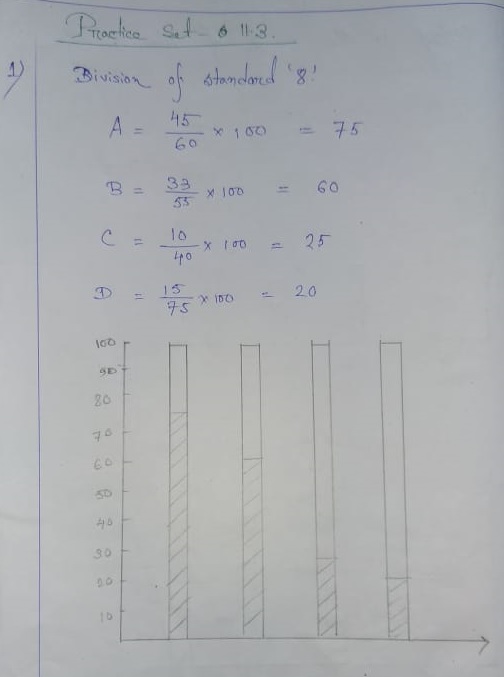
(1.) Show the following information by a percentage bar graph.
| Division of standard 8 | A | B | C | D |
| Number of students securring grade A | 45 | 33 | 10 | 15 |
| Total number of students | 60 | 55 | 40 | 75 |
SOLUTION:
(2) Observe the following graph and answer the questions

(1) State the type of the bar graph.
(2) How much percent is the Tur production to total production in Ajita’s farm ?
(3) Compare the production of Gram in the farms of Yash and Ravi and state whose percentage of production is more and by how much ?
(4) Whose percentage production of Tur is the least?
(5) State production percentages of Tur and gram in Sudha’s farm.
SOLUTION:

(3.) The following data is collected in a survey of some students of 10th standard from some schools. Draw the percentage bar graph of the data
| School | 1st | 2nd | 3rd | 4th |
| Inclination towards science stream | 90 | 60 | 25 | 16 |
| Inclination towards commerce stream | 60 | 20 | 25 | 24 |
Latest Edition BalBharati Math Solution for Standard 8th Chapter 11.3. Any Kinds of problem to understand, Feel free to comment us below. Thank You.