Selina Concise Class 10 Math Chapter 23 Graphical Representation (Histograms and ogives) Solutions
Graphical Representation
(Histograms and ogives)
(Q1) Draw histograms for the following frequency distributions
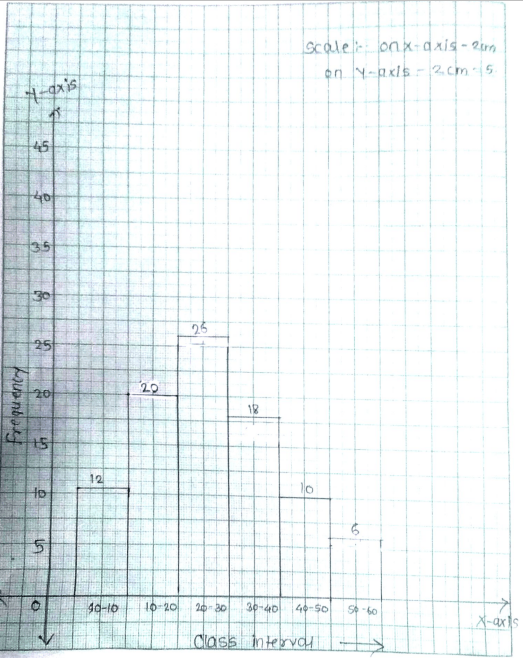
(i)
| Class interval | 0 – 10 | 10 – 20 | 20 – 30 | 30 – 40 | 40 – 50 | 50 – 60 |
| Frequency | 12 | 20 | 26 | 18 | 10 | 6 |
Solution:
First we have to draw given table
| Class Interval | Frequency |
| 0 – 10 | 12 |
| 10 – 20 | 20 |
| 20 – 30 | 26 |
| 30 – 40 | 18 |
| 40 – 50 | 10 |
| 50 – 60 | 6 |
(9) Graphical Representation
(i)
How to draw histogram
(1) First we have write scale
(2) Draw x-axis and y-axis
(3) Write frequency on y-axis and class interval on x-axis
(4) Draw rectangle type histograms on x-axis and corresponding frequencies as heights of histogram.
(ii)
| Class Interval | 10 – 16 | 16 – 22 | 22 – 28 | 28- 34 | 34 – 40 |
| Frequency | 15 | 23 | 30 | 20 | 16 |
Solution:
First we have draw given table
|
Class Interval |
Frequency |
| 10 – 16 | 15 |
| 16 – 22 | 23 |
| 22 – 28 | 30 |
| 28 – 34 | 20 |
| 34 – 40 | 16 |
* How to construct histograms?
(1) First we have draw x-axis and y-axis
(2) On x-axis we have to write class interval
(3) On y-axis we have to frequency
(4) This frequency is the height of histogram
(5) Histogram is like a rectangular shape

(iii)
| Class interval | 30 – 39 | 40 – 49 | 50 – 59 | 60 – 69 | 70 – 79 |
| Frequency | 24 | 16 | 09 | 15 | 20 |
Solution:
We can see that the given table, class interval is not continue so, first we have to do continue class interval.
| Class interval (Given) | Class interval (New) | Frequency |
| 30 – 39 | 29.5 – 39.5 | 24 |
| 40 – 49 | 39.5 – 49.5 | 16 |
| 50 – 59 | 49.5 – 59.5 | 09 |
| 60 – 69 | 59.5 – 69.5 | 15 |
| 70 – 79 | 69.5 – 79.5 | 20 |
In lower class we have to subtract 0.5 [30 – 0.5 = 29.5] and in upper class we have to add 0.5 [39+0.5 = 39.5]
(iii)
How to construct histograms
(1) First we have to do continue class interval
(2) Draw x-axis and y-axis
(3) On – x-axis we have to write class interval
(4) On y-axis we have to write frequency and frequency is a height of histogram.

(iv)
| Class Marks | 16 | 24 | 32 | 40 | 48 | 56 | 64 |
| Frequency | 8 | 12 | 15 | 18 | 25 | 19 | 10 |
Solution:
First we have to do class interval column.
In classes marks,
First class mark is 16 and second is 24 so the difference is 8 (24 – 16 = 8)
So the class interval is 12 – 20
(20 – 12 = 8)
|
Class Marks |
Class interval |
Frequency |
| 16 | 12 – 20 | 8 |
| 24 | 20 – 28 | 12 |
| 32 | 28 – 36 | 15 |
| 40 | 36 – 44 | 18 |
| 48 | 44 – 52 | 25 |
| 56 | 52 – 60 | 19 |
| 64 | 60 – 68 | 10 |
(iv) How to construct histogram?
(1) First we have to draw x-axis and y-axis
(2) Convert class mark into class interval
(3) On x-axis we have to write class interval and y-axis we have to write frequency
(4) Frequency is a height of histogram

(Q2)
Draw cumulative frequency curve (ogive) for each of the following distributions.
(i)
| Class interval | 10 – 15 | 15 – 20 | 20 – 25 | 25 – 30 | 30 – 35 | 35 – 40 |
| Frequency | 10 | 15 | 17 | 12 | 10 | 08 |
Solution:
| Class interval | Frequency |
| 10 – 15 | 10 |
| 15 – 20 | 15 |
| 20 – 25 | 17 |
| 25 – 30 | 12 |
| 30 – 35 | 10 |
| 35 – 40 | 08 |
* How to draw cumulative frequency curve or construction?
(1) First we have to draw x-axis and y-axis
(2) On x-axis we have to write class interval and on y-axis we have to write frequency
(3) Join the mid points of the rectangular or histogram to obtain the cumulative frequency curve

(ii)
| Class interval | 10 -19 | 20 – 29 | 30 – 39 | 40 – 49 | 50 – 59 |
| Frequency | 23 | 16 | 15 | 20 | 12 |
Solution:
First we have to do continue class interval because given class interval is not continue and after we have to draw cumulative frequency column.
| Class Interval (Given) | Class interval (New) | Frequency | Cumulative frequency |
| 10 – 19 | 9.5 – 19.5 | 23 | 23 |
| 20 – 29 | 19.5 – 29.5 | 16 | 23+16 = 39 |
| 30 – 39 | 29.5 – 39.5 | 15 | 39+15 = 54 |
| 40 – 49 | 39.5 – 49.5 | 20 | 54+20 = 74 |
| 50 – 59 | 49.5 – 59.5 | 12 | 74+12 = 86 |
| Total | 86 | ||
(Q2) (ii)
How to draw graph?
(1) First we have to draw x-axis and y-axis
(2) Convert class interval into continue class interval [In lower class 10-0.5 = 9.5] Subtract 0.5 from lower class.
(3) And draw cumulative frequency column
(4) On x-axis we have to write class interval and on y-axis we have to write frequency.

(Q3)
Draw an ogive each of the following distributions
(i)
| Marks obtained | Less than 10 | Less than 20 | Less than 30 | Less than 40 | Less than 50 |
| Number of students | 8 | 25 | 38 | 50 | 67 |
Solution:
First we have draw a given table:
| Marks Obtain | Number of students |
| Less than10 | 8 |
| Less than 20 | 25 |
| Less than 30 | 38 |
| Less than 40 | 50 |
| Less than 50 | 67 |
* How to draw or construct ogive?
(1) First we have to draw x-axis and y-axis
(2) On X-axis we have to write marks obtained and on y-axis we have to write number of students
(3) After we have to plot points (10, 8), (20, 25), (30, 38) (40, 50) and (50, 57) on the graph paper.
(4) After join this points for free hand (Not use rular)

ii)
| Age in years (less than) | 10 | 20 | 30 | 40 | 50 | 60 | 70 |
| Cumulative frequency | 0 | 17 | 32 | 37 | 53 | 58 | 65 |
Solution:
First we have to draw table
| Age in years (Less than) | Cumulative frequency |
| 10 | 0 |
| 20 | 17 |
| 30 | 32 |
| 40 | 37 |
| 50 | 53 |
| 60 | 58 |
| 70 | 65 |
* How to draw or construct ogiven?
(1) First we have draw x-axis and y-axis
(2) On x-axis we have write age in years and on y-axis we have write cumulative frequency.
(3) After we have to plot points (10,0), (20,17), (37,32) (40,37), (50,53), (60,58), an (70,65)
(4) After join this ploted point for free hand (Not use rular)

(Q4) Construct a frequency table for the number given below using the class intervals 21-30, 31-40, etc,
75, 67, 57, 50, 26, 33, 44, 58, 67, 75, 78, 43, 41, 31, 21, 32, 40, 62, 54, 69, 48, 47, 51, 38, 39, 43, 61, 63, 68, 53, 56, 49, 59, 37, 40, 68, 23, 28, 36, 47
Use the table obtained to draw:
Solution:
Firs we have to draw table –
| Class interval | Tally | Frequency | Cumulative Frequency |
| 21 – 30 | II II | 4 | 4 |
|
31 – 40 |
|
9 | 9+4 = 13 |
| 41 – 50 | 9 | 13+9 = 22 | |
| 51 – 60 | 7 | 22+7 = 29 | |
| 61 – 70 | 8 | 29+8 = 37 | |
| 71 – 80 | III | 3 | 37+3 = 40 |
Tally: In 21-30 there are 4 numbers so, we have to draw four lines.
In 31 – 40 there are 9 numbers so, we have to draw 9 lines in tally table
In 41 – 50 there are 9 numbers so, we have to draw 9 lines
In 51 – 60 there are 7 numbers so, we have to draw 7 lines
In 61 – 70 there are 8 numbers so, we have to draw 8 lines
In 71 – 80 there are 3 numbers so, we have to draw 3 lines.


Here is your solution of Selina Concise Class 10 Math Chapter 23 Graphical Representation (Histograms and ogives)
Dear Student, I appreciate your efforts and hard work that you all had put in. Thank you for being concerned with us and I wish you for your continued success.